StarCare Animals
The relationship between changes in the electrocardiogram (ECG) axis and cardiac hypertrophy in cats and dogs can be understood through the following points:
ECG Axis Basics:
The ECG axis refers to the general direction of the heart's electrical depolarization.
It is usually assessed in the frontal plane using leads I, II, and III [Note].
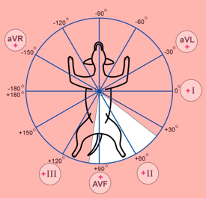
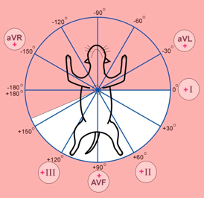
A normal axis in dogs ranges from approximately +40° to +100°, while in cats, it ranges from +0° to +160°.
Cardiac Hypertrophy:
Cardiac hypertrophy involves an increase in the size of the heart's muscle cells, leading to a thicker heart wall.
It can be classified into two types: concentric hypertrophy (thickening of the heart wall without chamber dilation) and eccentric hypertrophy (thickening with chamber dilation).
ECG Axis Changes in Cardiac Hypertrophy:
In both dogs and cats, cardiac hypertrophy can cause shifts in the ECG axis due to the altered electrical activity resulting from the hypertrophied myocardium.
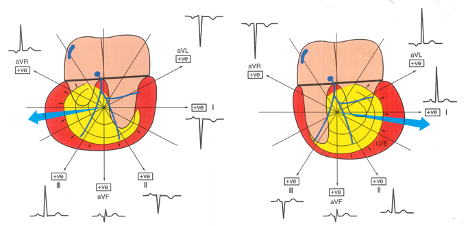
Left Ventricular Hypertrophy (LVH): This often results in a left axis deviation (LAD). In dogs, a left axis deviation may be indicated by an axis more negative than +40°. In cats, LAD is less common but can still occur.
Right Ventricular Hypertrophy (RVH): This can cause a right axis deviation (RAD). In dogs, RAD is typically indicated by an axis more positive than +100°. In cats, an axis beyond +160° may indicate right ventricular involvement.
Clinical Significance:
Detecting changes in the ECG axis is important for diagnosing the type and extent of cardiac hypertrophy.
Axis deviations can help differentiate between primary and secondary cardiac conditions. For instance, primary hypertrophic cardiomyopathy (HCM) in cats commonly results in left axis deviation.
In dogs, conditions like dilated cardiomyopathy (DCM) may present with both left and right axis deviations depending on the disease stage and ventricular involvement.
Diagnostic Approach:
Regular ECGs can help monitor the progression of hypertrophy and the effectiveness of treatment.
In conjunction with other diagnostic tools like echocardiography, changes in the ECG axis can guide veterinarians in managing cardiac hypertrophy in pets.
In summary, changes in the ECG axis in cats and dogs are indicative of cardiac hypertrophy. Left axis deviation typically suggests left ventricular hypertrophy, while right axis deviation suggests right ventricular hypertrophy. Understanding these changes is crucial for the diagnosis and management of cardiac conditions in these animals.
[Note] The ECG machine of StarCare Animals provides automatic measurement of the electric axis.
References
Mark D. Kittleson, Heart Disease: Conduction Abnormalities in Dogs and Cats, https://www.merckvetmanual.com/circulatory-system/heart-disease-conduction-abnormalities-in-dogs-and-cats/heart-disease-conduction-abnormalities-in-dogs-and-cats, Jan 2023
Douglass K. Macintire, Kenneth J. Drobatz, Steve C. Haskins, and William D. Saxon, Manual of Small Animal Emergency and Critical Care Medicine, Second Edition. © 2012 John Wiley & Sons, Inc.


The normal axis range in dogs (left) is approximately +40° to +100°, whereas the normal axis range in cats (right) is approximately +0° to +160° (AHT Talk.key, canadawestvets.com).

| Axis in right ventricular hypertrophy (marked by the big blue arrow): note that the R wave in lead III is higher than in lead II (positive), and the aVR is positive (usually negative), which is due to a right axis deviation (Mike Martin, An Introductory Guide, 2015 John Wiley & Sons, Ltd). | Axis in left ventricular hypertrophy (marked by large blue arrows): note that the R wave in leads I and aVL is higher (positive) than in lead III, and the ECG axis is left axis deviation (Mike Martin, An Introductory Guide, 2015 John Wiley & Sons, Ltd). |

Left ventricular enlargement in a dog. Left axis deviation pattern is noted - increased R wave amplitude in left-ward directed leads (i.e. I, II, III, aVF) (https://sites.tufts.edu/cardiorush/faculty-syllabus-electrocardiography-concepts-1/).